Site Explorer

Please click on a green point on the map to select a site

Loading...
Loading...


Loading...


Loading...


Loading...


Loading...


Loading...


Loading...


Loading...


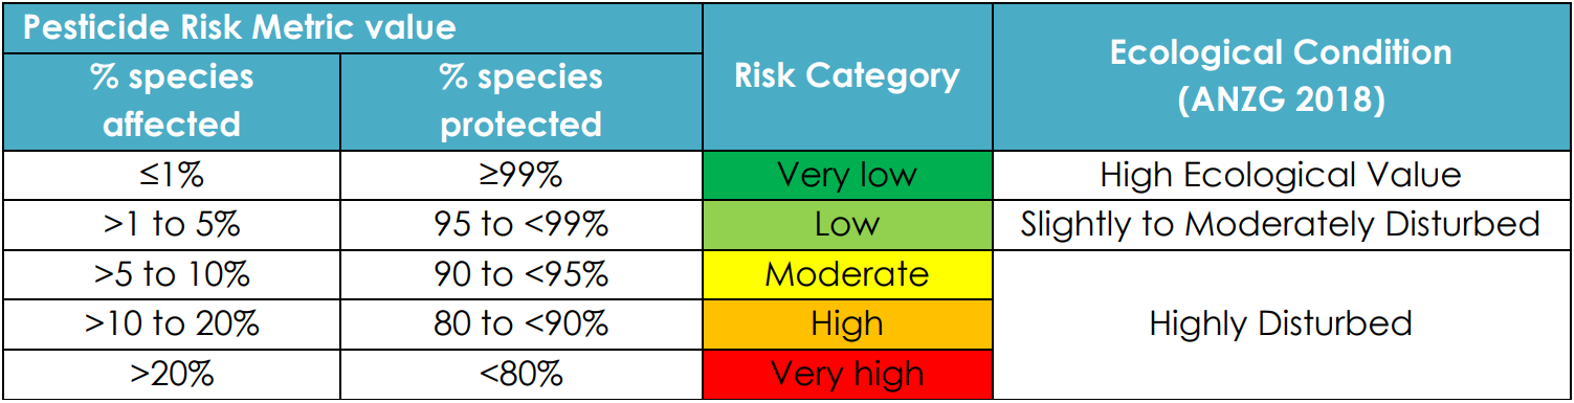
Wet Season PRM values are colour coded with ANZG categories of ecosystem condition:

Table of ANZG risk categories of ecosystem conditions ranging from Very Low to Very High

Loading...


Loading...

Pesticide Monitoring

Pesticides are routinely used in agricultural and other land management practices. They are typically categorised as insecticides, herbicides or fungicides. Pesticide run-off potentially impacts the environmental values of our rivers, streams and coastal waters. The Department of the Environment, Tourism, Science and Innovation runs water quality monitoring programs that collect and analyse water samples from coastal river basins for pesticides.

Pesticide concentration data for 24 different pesticides, including ten photosystem II herbicides (e.g. diuron, atrazine), ten other herbicides (e.g. 2,4-Dichlorophenoxyacetic acid (2,4-D), metolachlor) and four insecticides (chlorpyrifos, diazinon, fipronil, imidacloprid) can be viewed graphically in the Pesticide Reporting Portal. Of those 24 pesticides, 22 pesticides are currently considered the greatest risk to coastal freshwater and marine aquatic ecosystems in the Great Barrier Reef catchment area.

The combined toxicity risk of these 22 pesticides is estimated by the Pesticide Risk Metric. The risk is expressed as the percentage of species potentially affected (or conversely, protected) by the combined toxicity of the 22 pesticides over a standardised wet season (182 days from the first flush event). These estimates can be compared to the three categories of ecosystem condition, as defined in the Australian and New Zealand Guidelines for Fresh & Marine Water Quality:

The Reef 2050 Water Quality Improvement Plan pesticide target is: to protect at least 99% of aquatic species at the end-of-catchments. The Pesticide Risk Metric results presented here are for waterways monitored under the Great Barrier Reef Catchment Loads Monitoring Program and should be interpreted as an assessment of current risk at the monitoring site. The risk values should not be used as an indicator of progress towards the WQIP pesticide reduction target. For more information on pesticide risk at a basin level and progress to targets, refer to the Reef Water Quality Report Card.

The Pesticide Risk Metric method is also used to calculate relative contributions of individual pesticides to the toxicity risk using the following formula:

More information about the Pesticide Risk Metric can be found in the foundational method document: Development of a Method for Estimating the Toxicity of Pesticide Mixtures and a Pesticide Risk Baseline for the Reef 2050 Water Quality Improvement Plan

Water Quality & Investigations Team

The Water Quality and Investigations team sits within the Water Ecosystem Science branch, in the Department of the Environment, Tourism, Science and Innovation, Queensland Government. The team includes highly specialised water quality scientists, statisticians, technical specialists, hydrographers, ecotoxicologists and GIS experts.

The team is responsible for the delivery of two key water quality monitoring programs: the Great Barrier Reef Catchment Loads Monitoring Program and the South East Queensland Catchment Loads Monitoring Program. Both programs support the monitoring and reporting roles of the Department as part of Reef 2050 WQIP and South East Queensland Healthy Waterways initiatives.

Further to these programs, the team is actively involved in environmental investigations, assessments and analyses relating to pollution events, ecotoxicology, water quality, and aquatic ecosystem health.

Citation

Water Quality & Investigations (2023) Pesticide Risk Metric Dashboard, Department of Environment, Science and Innovation, Brisbane, Australia.

Contact

For more information about the Great Barrier Reef Catchment Loads Monitoring Program please contact wqi@qld.gov.au

How to explore these data

There are two main pages to explore data: the Interactive Map page and the Data Explorer page. The Interactive Map page is useful to explore where monitored sites are located within Queensland and when selected, the all data for the site will be displayed in the left panel. The Data Explorer page is useful to filter and display data by region, site and year.

Site Explorer (Interactive Map page)

The interactive map displays all monitored sites as a green dot which you can zoom into areas of interest and site names will appear. Click on the green site dot for the PRM data to appear in the left hand panel. The wet season Individual Pesticide Contributions will appear in the top of the left panel where pesticide groups can be toggled through to change what group of pesticides are displayed in the plot. The ‘Total Pesticides + species protected’ shows an additional y axis with the percent protected score at the top of the bar for each year. The bottom panel shows the daily PRM plot for the site for the selected monitoring year. If available, sampling year for the selected site can be changed which will change the plot displayed.


Individual Pesticide contribution plots

Plots have several interactivity features. Hovering your cursor over the individual pesticide of interest will display the pesticide name. By single clicking on a pesticide in the legend, this will remove the pesticide from the plot if only certain pesticides are of interest. Clicking it again will return it to the plot display. Double clicking on a pesticide in the legend will display only that pesticide on the plot, the species affected axis scale will change accordingly. Double clicking again on the same pesticide will return the plot to its default version. When a single pesticide is displayed on the plots, additional pesticides of interest can be added onto the plot by single clicking their respective name in the legend. If a pesticide does not contribute more than 0.001% to the risk then it will not show any contribution on the plot when it is selected in the legend. Double click on one of the selected pesticides to show only that pesticide, then double click again to return to the default view for the plot. This interactivity is available on all pesticide grouping plots. Plots can be downloaded by hovering the cursor over the top right of the plot and selecting the camera symbol. This will download the plot as a PNG to your device.


Daily PRM Plots

Plots are interactive where you can hover over a data point to see the PRM value for that date for the site. Data points are colour coded to the corresponding risk category. For graphical convenience, all PRM values that are <0.1 have been fixed at a value of 0.05. The water level when hovered over will also show the height for the selected date. To zoom in on a plot, click and drag over an area of interest. To reset the plot to its default window, select the reset axes symbol (house symbol). Plots can be downloaded by selecting the camera symbol in the top right corner of the plot. The data is also downloadable by selecting the ‘Download Daily Average Site Data’ button which will download all available daily PRM data for the selected site.


Daily Average Time Series (Data Explorer page)

The Daily Average Time Series section shows the daily PRM value for each monitoring year for each site with a hydrograph overlay. Plots are available for Total Pesticides, PSII pesticides, Other herbicides and Insecticides. Sites are selected using the dropdown menu. Plots have the same interactivity as the daily plots on the Interactive Map page. The data is also downloadable by selecting the ‘Download Daily Average Data’ button which will download all available daily PRM data for all sites and years available.


Pesticide Contribution Plots (Data Explorer page)

The Pesticide Contribution plots can be displayed by region, site and sampling year. When a region is selected, all sites within that region will be selected by default, however sites can be selected and deselected individually by selecting the ‘tick’ next to the site name. Selection process is the same for sampling years. Pesticide contribution plot legend displays all 22 pesticides included in the PRM. Hovering your cursor over the individual pesticide of interest will display the pesticide name and the Species affected (%) for the individual pesticide. Plots have the same interactivity features as those on the Interactive Map page and can be downloaded.


There are several ways to zoom in on plots. Clicking and dragging over the area of interest is easiest. The plot can then be returned to the default zoom level using the reset axes symbol (house symbol) or the autoscale symbol (multidirectional arrow symbol). Plots can also be zoomed using the + and - symbols.


Overview Table (Data Explorer page)

The Overview table displays the PRM results tabulated for all sites for all years. PRM can be displayed by Species Affected (%) and Species Protected (%). The number of results displayed can be changed using the drop down. Sites can be searched by typing either the site name or region into the ‘Search’ text box. All Wet Season PRM data can be downloaded using the green button.


Contact

  • For more information about the Great Barrier Reef Catchment Loads Monitoring Program please contact wqi@qld.gov.au

Disclaimer

  • The Department of the Environment, Tourism, Science and Innovation runs water quality monitoring programs that collect and analyse water samples from coastal river basins for pesticides as part of the Great Barrier Reef Catchment Loads Monitoring Program

  • 22 pesticides are currently considered the greatest risk to coastal freshwater and marine aquatic ecosystems in the Great Barrier Reef catchment area. The combined toxicity risk of these 22 pesticides is estimated by the Pesticide Risk Metric (PRM)

  • The risk is expressed as the percentage of species potentially affected (or conversely, protected) by the combined toxicity of the 22 pesticides over a standardised wet season (182 days from the first flush event)

  • The PRM results presented here are for waterways monitored under the Great Barrier Reef Catchment Loads Monitoring Program and should be interpreted as an assessment of risk at the monitoring site

  • For graphical convenience, all PRM values that are <0.1 have been fixed at a value of 0.05

  • More information about the PRM can be found in the “About” tab and in the foundational method document: Development of a Method for Estimating the Toxicity of Pesticide Mixtures and a Pesticide Risk Baseline for the Reef 2050 Water Quality Improvement Plan

The Pesticide Risk Metric Dashboard provides several ways to interrogate the data:

  • through daily PRM plots that display the PRM for each day on which water samples were collected. These daily PRM scores are frequently an average of several samples taken over the day

  • through a tabulated display of the wet season summary PRM values representing the average PRM over 182 days following the first flush event

  • through a display of the relative contributions of individual pesticides to the toxicity risk.

Although every effort is made to ensure the accuracy of the data, the Department of the Environment, Tourism, Science and Innovation makes no representations or warranties about its accuracy, reliability, completeness or suitability for any particular purpose and disclaims all responsibility and all liability (including without limitation, liability in negligence) for all expenses, losses, damages (including indirect or consequential damage) and costs which might be incurred as a result of the information being inaccurate or incomplete in any way and for any reason.

For more information on the program, the team and who to contact visit the “About” tab.


For help on how to use the app please visit the “Help” tab.